
Market Overview Week of February 13
- Tommaso Sini

- Feb 17, 2023
- 4 min read
Updated: Jun 12, 2023

Market Synopsis: Equities down, Treasury Yields up, Commodities down, Dollar up, Crypto up
Past Week Events:
- CPI came out this week on Tuesday. CPI measures the change in prices of goods and services for consumers. It serves as a central measure of inflation and a key indicator for the economy. Inflation came in slightly hotter than expected rising 0.5 percent in the month of January. Markets did not react in a major way to the print as the S&P closed almost flat on the day. This illustrates the fact that inflation is no longer necessarily the center of attention and focus may be shifting towards recessionary fears.
- Another important measure of inflation PPI, the producer price index, which measures the price of goods and services on the producers' side was released on Thursday. The index showed an increase of 0.7% which was hotter than expected. Markets did react as the report prompted the Dow to fall about 200 points. However, the reaction was not massive as it seems that some economists are brushing off the most recent print due to seasonal factors.
- A number of Federal Reserve members spoke this week. Mester, Bullard, Williams and Barkin all spoke this week. The underlying themes of their statements were similar. They all underscored the idea of higher rates for longer hurting optimism for a Fed Pivot. Their hawkish remarks put downward pressure on markets.
- Gross Domestic Product (GDP) is released next week. GDP is the value of the goods and services produced within a country. In the fourth quarter of 2022, national GDP went up by 2.9%. Investors will be wary.
- PCE serves as another key measure of inflation. It is very similar to the CPI(Consumer Price Index) as it measures the prices of goods and services consumed by households, but the way it is calculated differs. This PCE is extremely anticipated by investors, because the last CPI report shocked investors with an increase despite high interest rates. A higher CPI indicates increased inflation, and if this same trend continues with PCE this can be frightening.
- The FOMC meets periodically discussing macroeconomic conditions and establishes a monetary policy plan based on the conditions. Interest rates have been continuously hiked recently because of inflation. Despite high rates, the recent CPI report showed a slight spike in inflation, and so next week’s FOMC minutes will be interesting to see how they respond to this.
Market Snapshot:
- The indices all closed lower on the week. The S&P out of the major indexes underperformed the most while the Russel which tracks smaller companies outperformed. Sentiment on Wallstreet has turned quite bullish as markets have rallied since the beginning of the year. However, there appears to be some downward pressure on markets, especially with hawkish remarks coming from the Federal Reserve. Also, it seems that focus is shifting away from concerns of inflation to recessionary fears and slowed growth. Investors will have to carefully way what the macro economic environment will look like in the next 6 months.
Quip of the Week: “Why did the stock market investor bring a horse to the exchange?
Because he heard it was a stable investment!”
U.S Equities:
- Indexes(Week)

SPX 4,079.09(-0.28%), DJIA 33,826.69(-0.13%),
NASDAQ 11,787.27(0.59%), RUT 1,946.36(1.44%)
Sectors

- Most sectors were split down the middle with half in the green and half in the red moderately. However, Energy tanked on the week closing down over 6 percent. Energy's underperformance seems to stem from oil. The fall in oil prices is articulated on later in the summary.
Treasuries:

- Treasury Yields were up substantially this week. The 30-year treasury underperformed while shorter-term treasuries like the 2-year outperformed. The recent climb in yields is most like due to the hawkish remarks made by Federal Reserve members as well as an increase in the terminal Federal Funds rate. Expectations of 50bps point hike at the next FOMC meeting are still slim but have climbed to 12%.
Commodities:
Oil
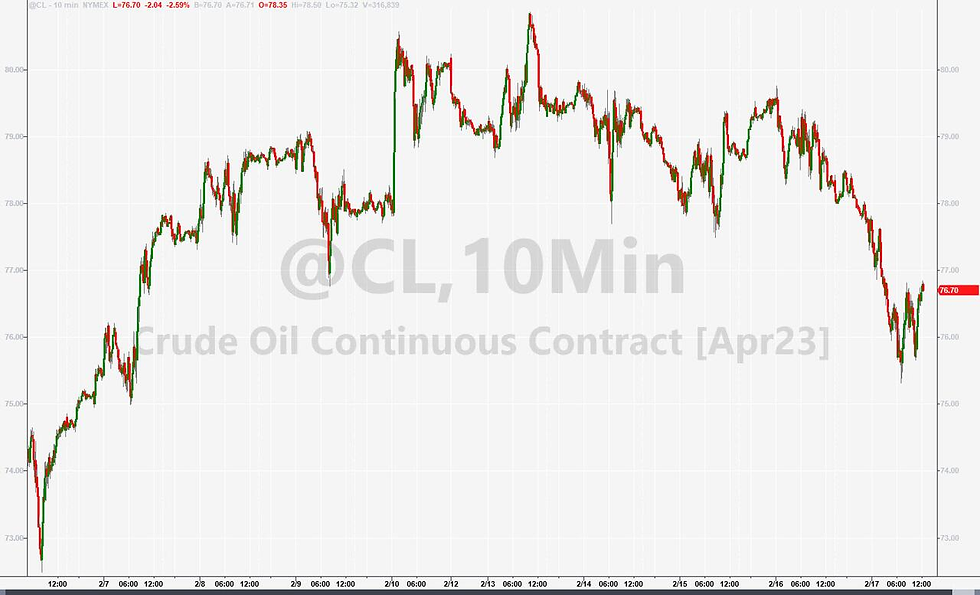
- Oil’s sharp recovery that was seen last week did not continue on into this week. WTI fell to about 76$ a barrel. The reason for the decline in oil this week is twofold. First, hawkish rhetoric from the Federal Reserve as suppressed prices. Second, it has become apparent there is “ample” supply of oil right now.
Gold

- Gold likewise fell on the week making this the third straight week in a row with falling prices. The fall in gold prices comes at a stronger dollar because of the hawkish remarks from the Federal Reserve.
BTC -24,501, 13.73% ETH - 1,691.77 -12.26%

- Bitcoin has risen substantially over the past week touching 25,000$ a coin several times. The surge in price coincides with the release of the Ordinals Protocol which allows for essentially Bitcoin-based NFTs. This has led to some expecting an increase in transactions on the Bitcoin blockchain which might boost the price higher.
Europe:
Stoxx 600- 464.30, 1.40% DAX -15,482, 1.14% FTSE 100 -8,004, 1.55%
Chart of the DAX (5-day)

- A survey by Dynata indicates that a significant amount of Germans experience financial hardship because of uncertainty with high inflation. Despite the ECB aggressively hiking rates, this shows how inflation has been affecting everyone in very negative ways.
Asia:
XJO (Australia)-7,346, -1.17% Shanghai 180 Index-8,485, -1.35% Nikkei 225- 27,513, -0.57%
XJO 5-day Chart


